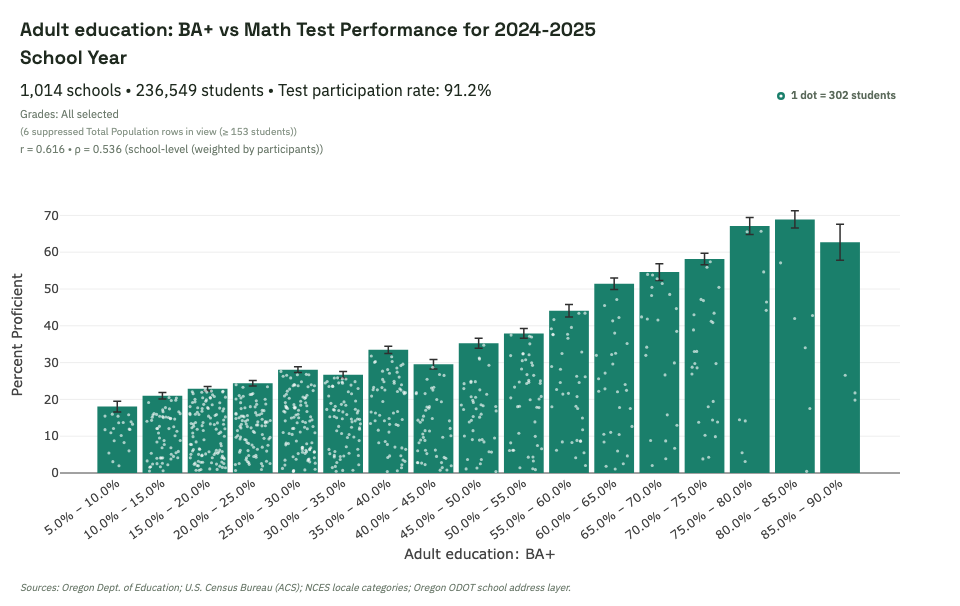
Adult education and student test performance
Proficiency rises across much of the adult-education spectrum, with no obvious single cutoff where results suddenly jump.
Short, data-grounded reads on Oregon school outcomes and community context. Each highlight pairs a visual with interpretation and a direct link to the live dashboard view.
Proficiency rises across much of the adult-education spectrum, with no obvious single cutoff where results suddenly jump.
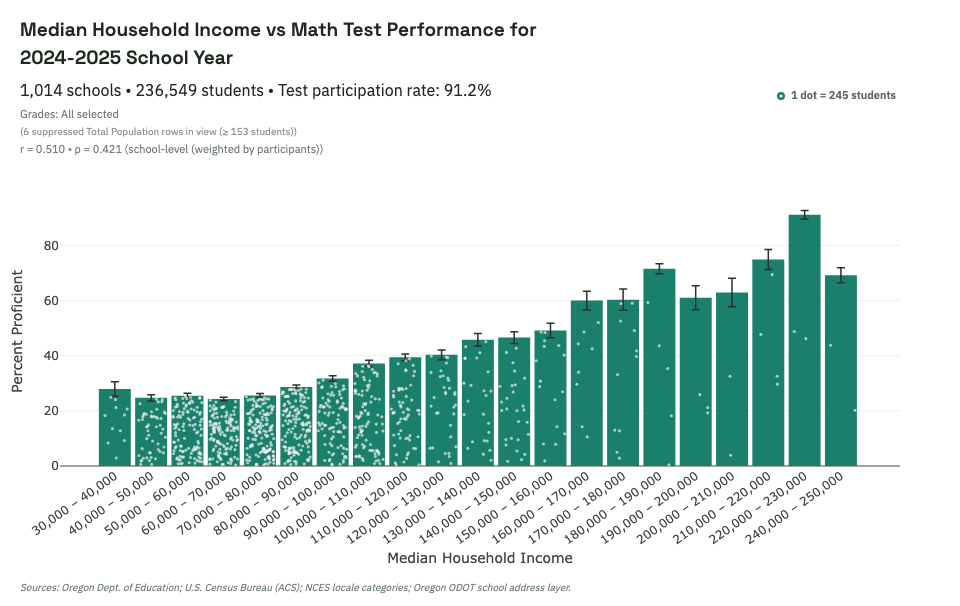
Income is linked to performance too, but this view is most useful when compared side-by-side with education and attendance.
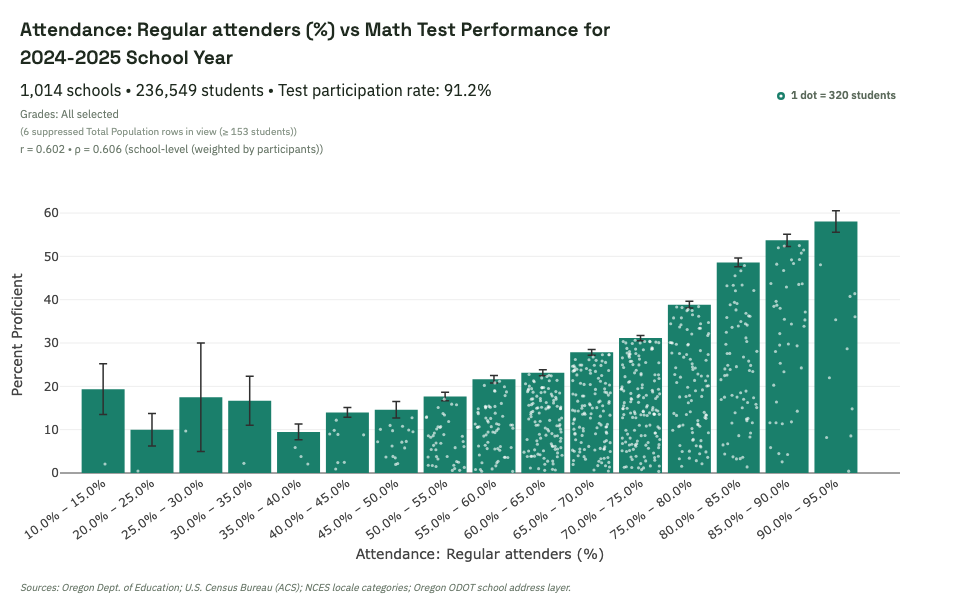
Attendance shows one of the strongest visible gradients in the dashboard.
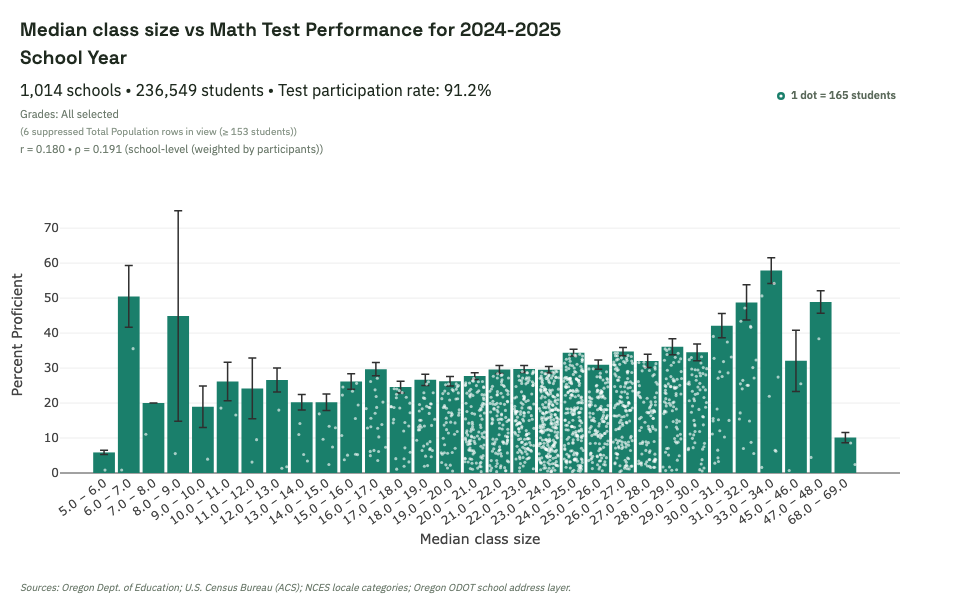
Class size appears weaker and less regular statewide than attendance, adult education, or income.
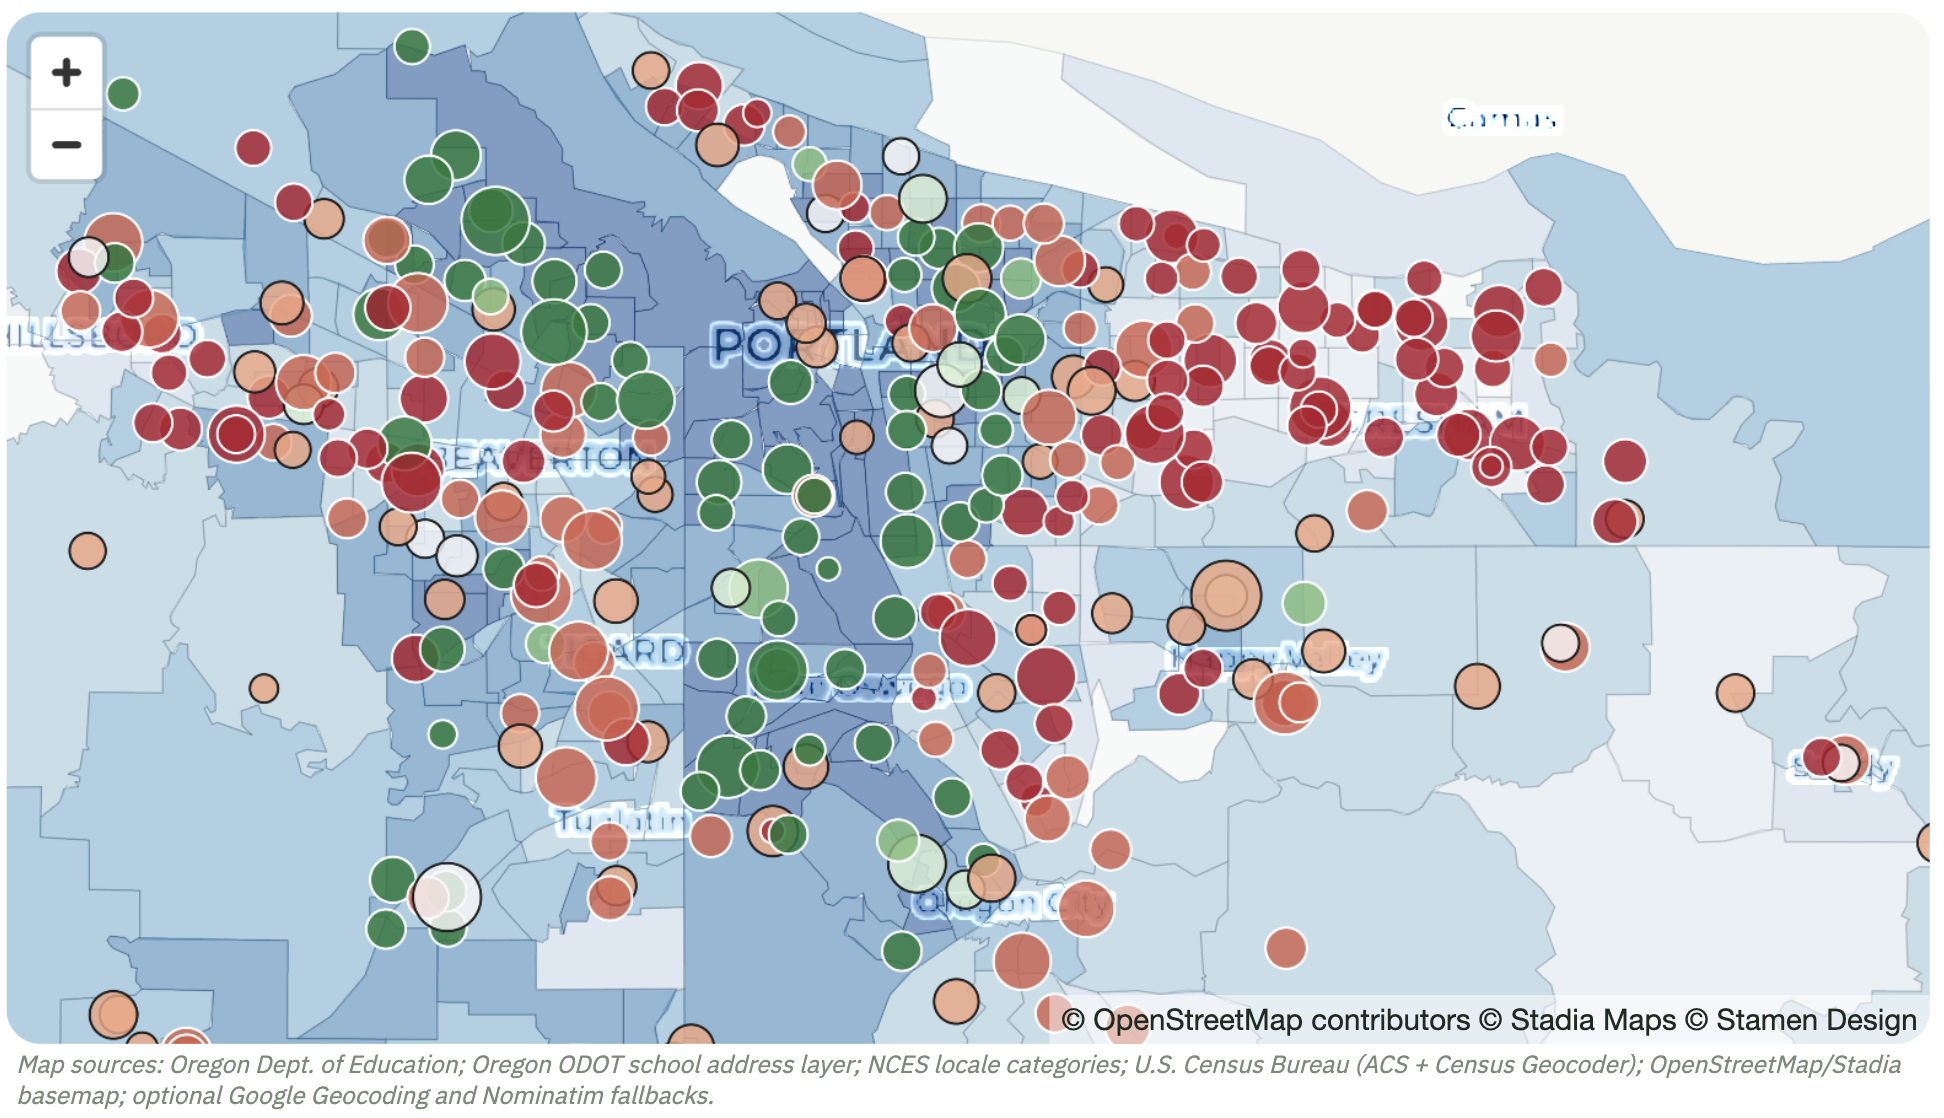
In Portland-area maps, higher-performing schools often cluster where surrounding adult-education levels are highest.
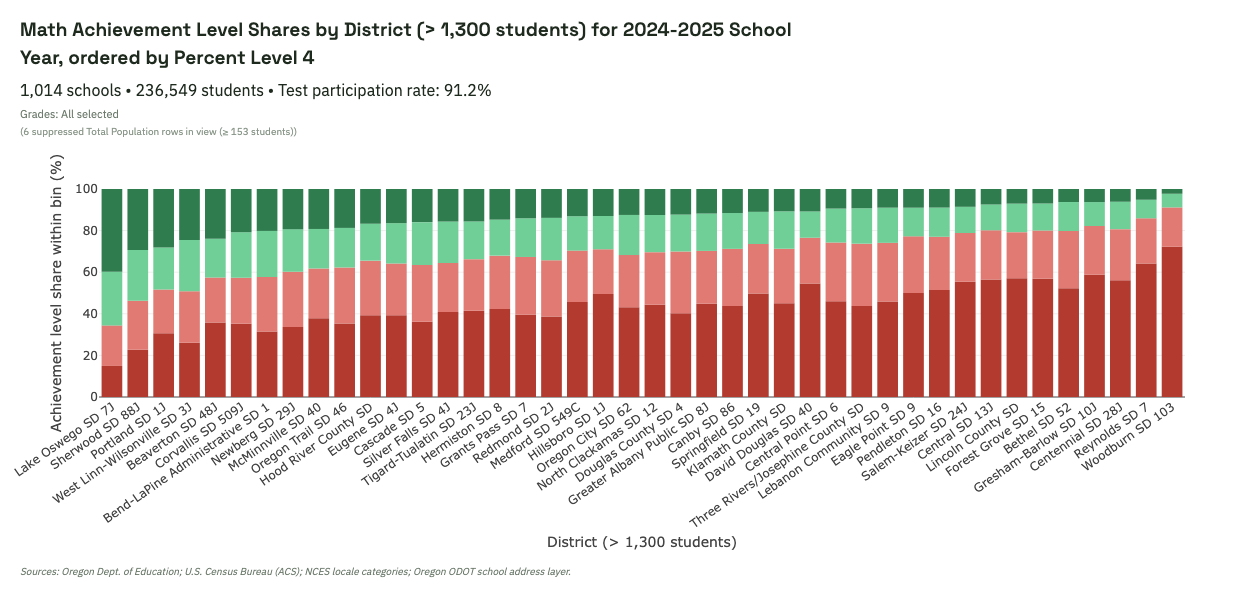
Compare Level 1–4 achievement shares across districts, ordered by Level 4 results.
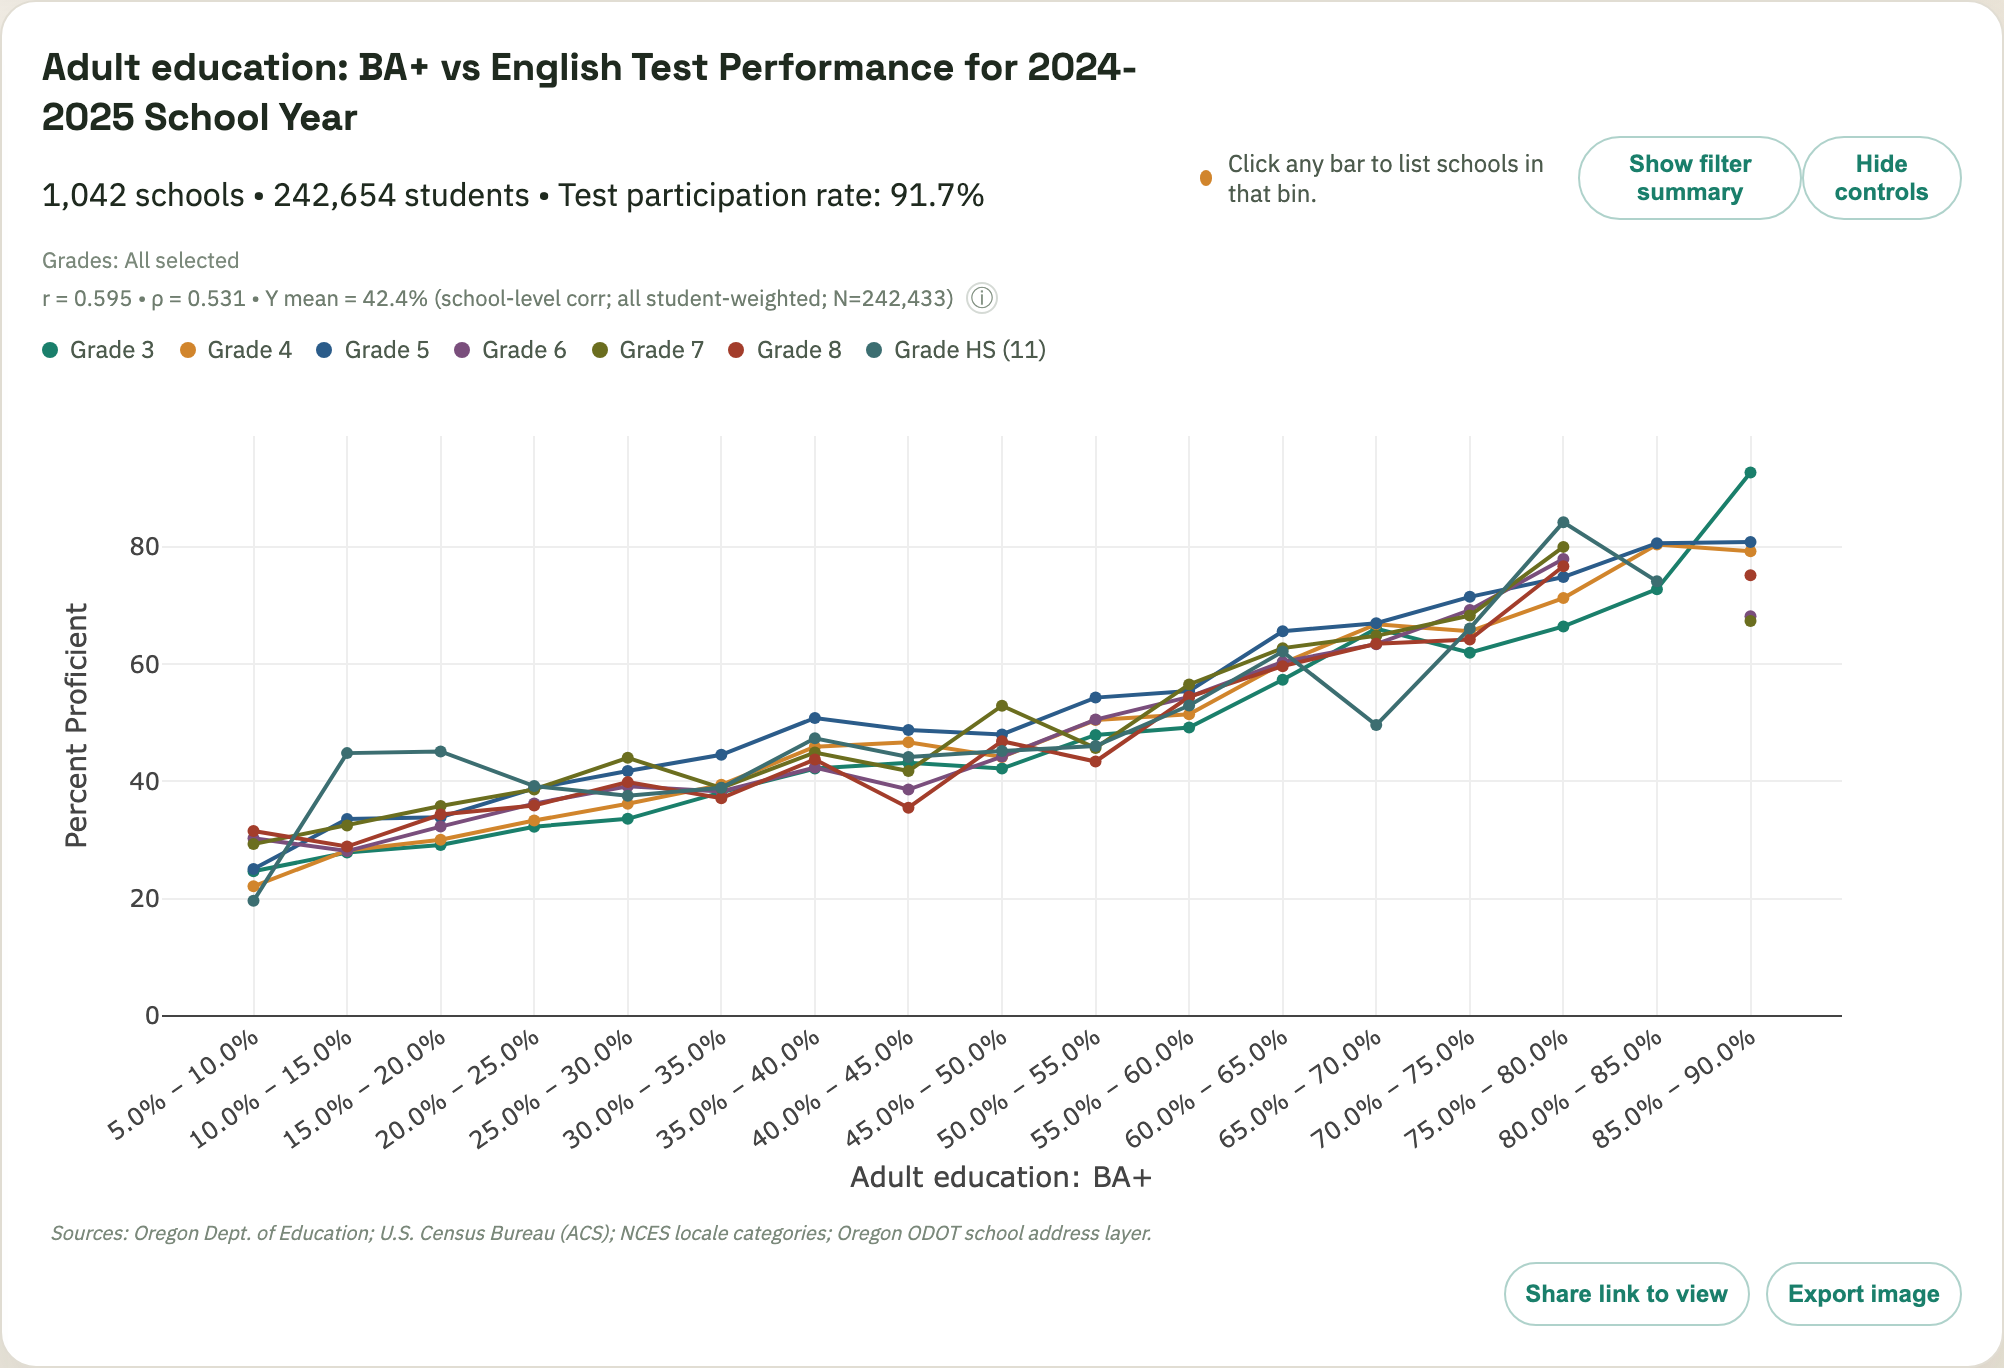
Across nearly every grade, lower-BA+ school contexts align with lower English proficiency, making the demographic gradient a broad statewide pattern rather than a one-grade exception.