Statistical reports and source scripts
A reader-friendly synthesis of the numeric analyses behind the Evidence Lab findings,
followed by grouped links to detailed reports, source scripts, figures, and machine-readable outputs.
Scope reminder: these are school-level association models. The 2024-25 achievement models
weight schools by students with reported Level 1-4 results.
They support effect ordering and robustness checks, not causal claims.
At a glance
- The strongest recurring school-level signals are student poverty concentration, attendance, and adult BA+ context.
- Income remains correlated with outcomes, but usually has small unique signal after controls.
- In 2024-25 models, ODE Students Experiencing Poverty is a first-tier factor and often rivals or exceeds adult BA+ in explanatory strength.
- Spending/class-size effects are weaker and less stable in statewide cross-sectional models.
- The adult-education-over-income ordering remains stable across split checks and pre-pandemic (2018-2019 Math) runs.
Model setup
- Unit: school rows (not student-level microdata).
- Weights: students with reported Level 1-4 results for 2024-25 achievement models.
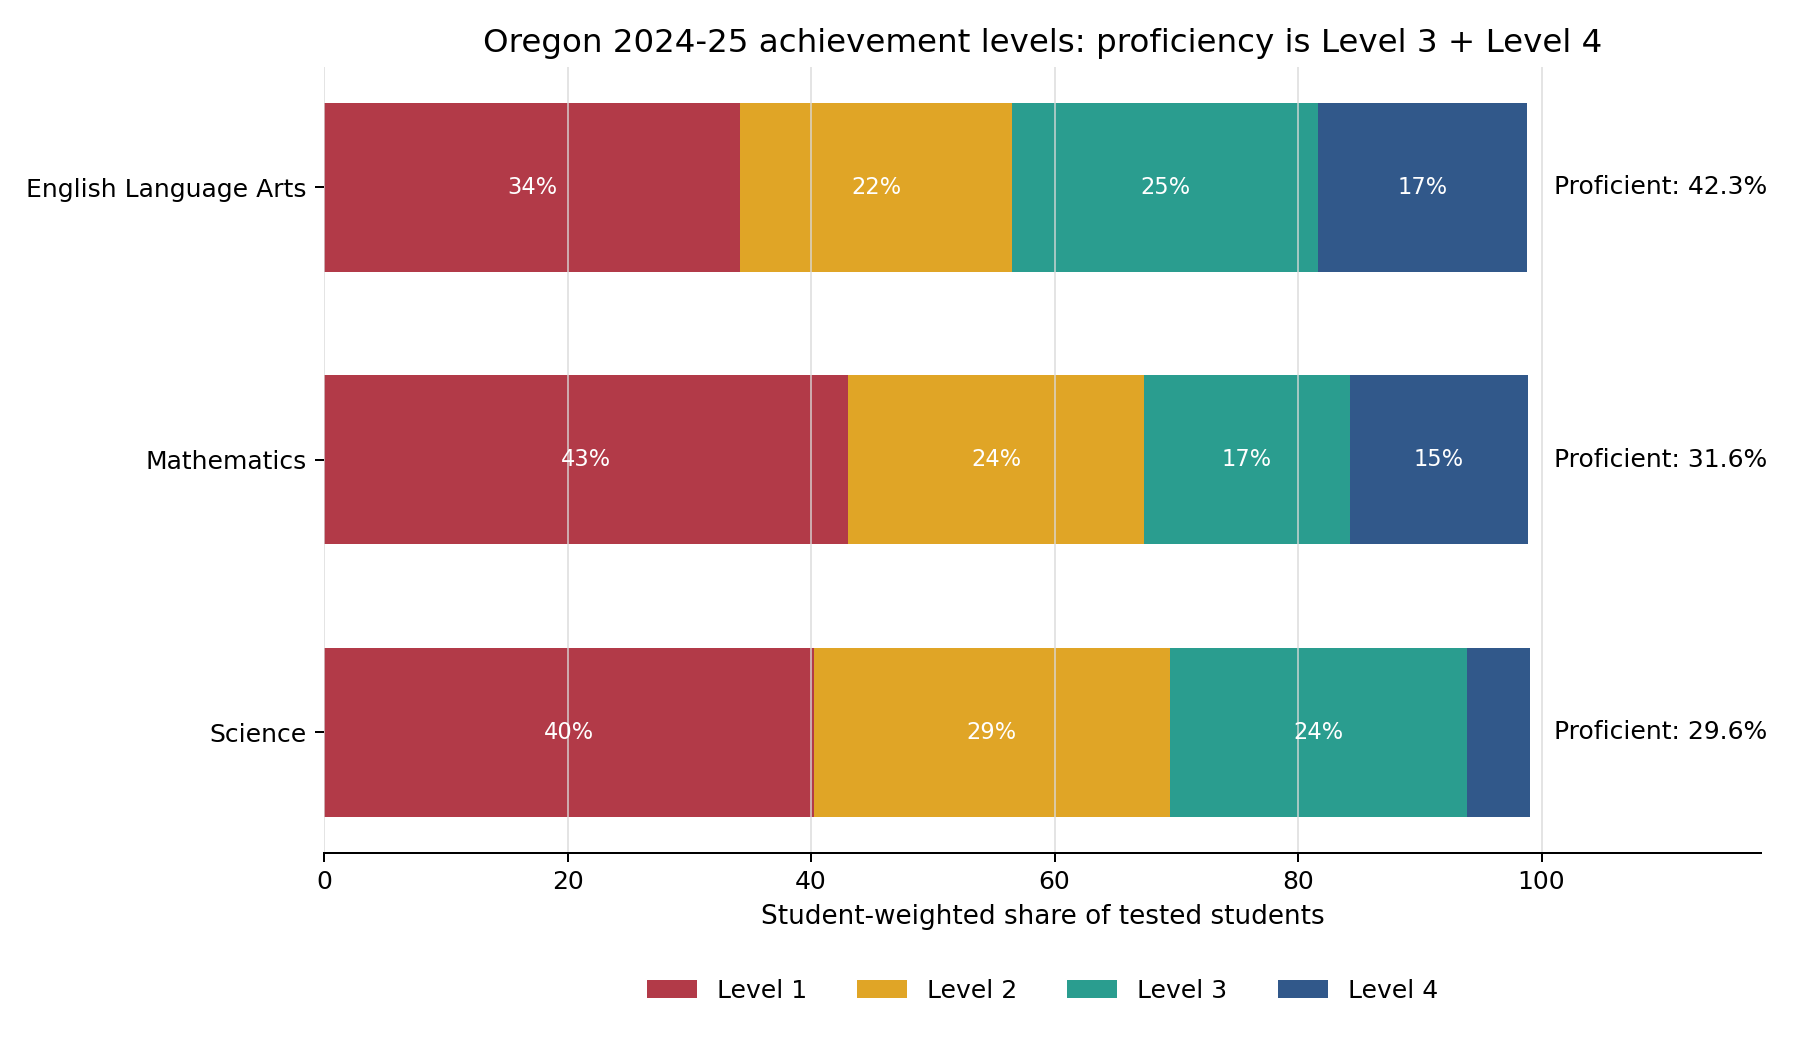
- Main outcome: Percent Proficient.
- Baseline continuity spec: income, adult BA+ rate, attendance.
- Companion 2024-25 spec: poverty, adult BA+ rate, attendance (with optional income add-back).
- Exploratory predictors: overall spending per student, classroom spending per student, median class size.
Joint model results by subject
Baseline continuity spec: Percent Proficient ~ income + education + attendance
| Subject |
Beta income |
Beta education |
Beta attendance |
R^2 |
| English (ELA) |
0.024 |
0.464 |
0.298 |
0.417 |
| Math |
0.045 |
0.433 |
0.412 |
0.517 |
| Science |
0.005 |
0.459 |
0.252 |
0.349 |
In this baseline income/education/attendance specification, education and attendance carry the largest controlled signals.
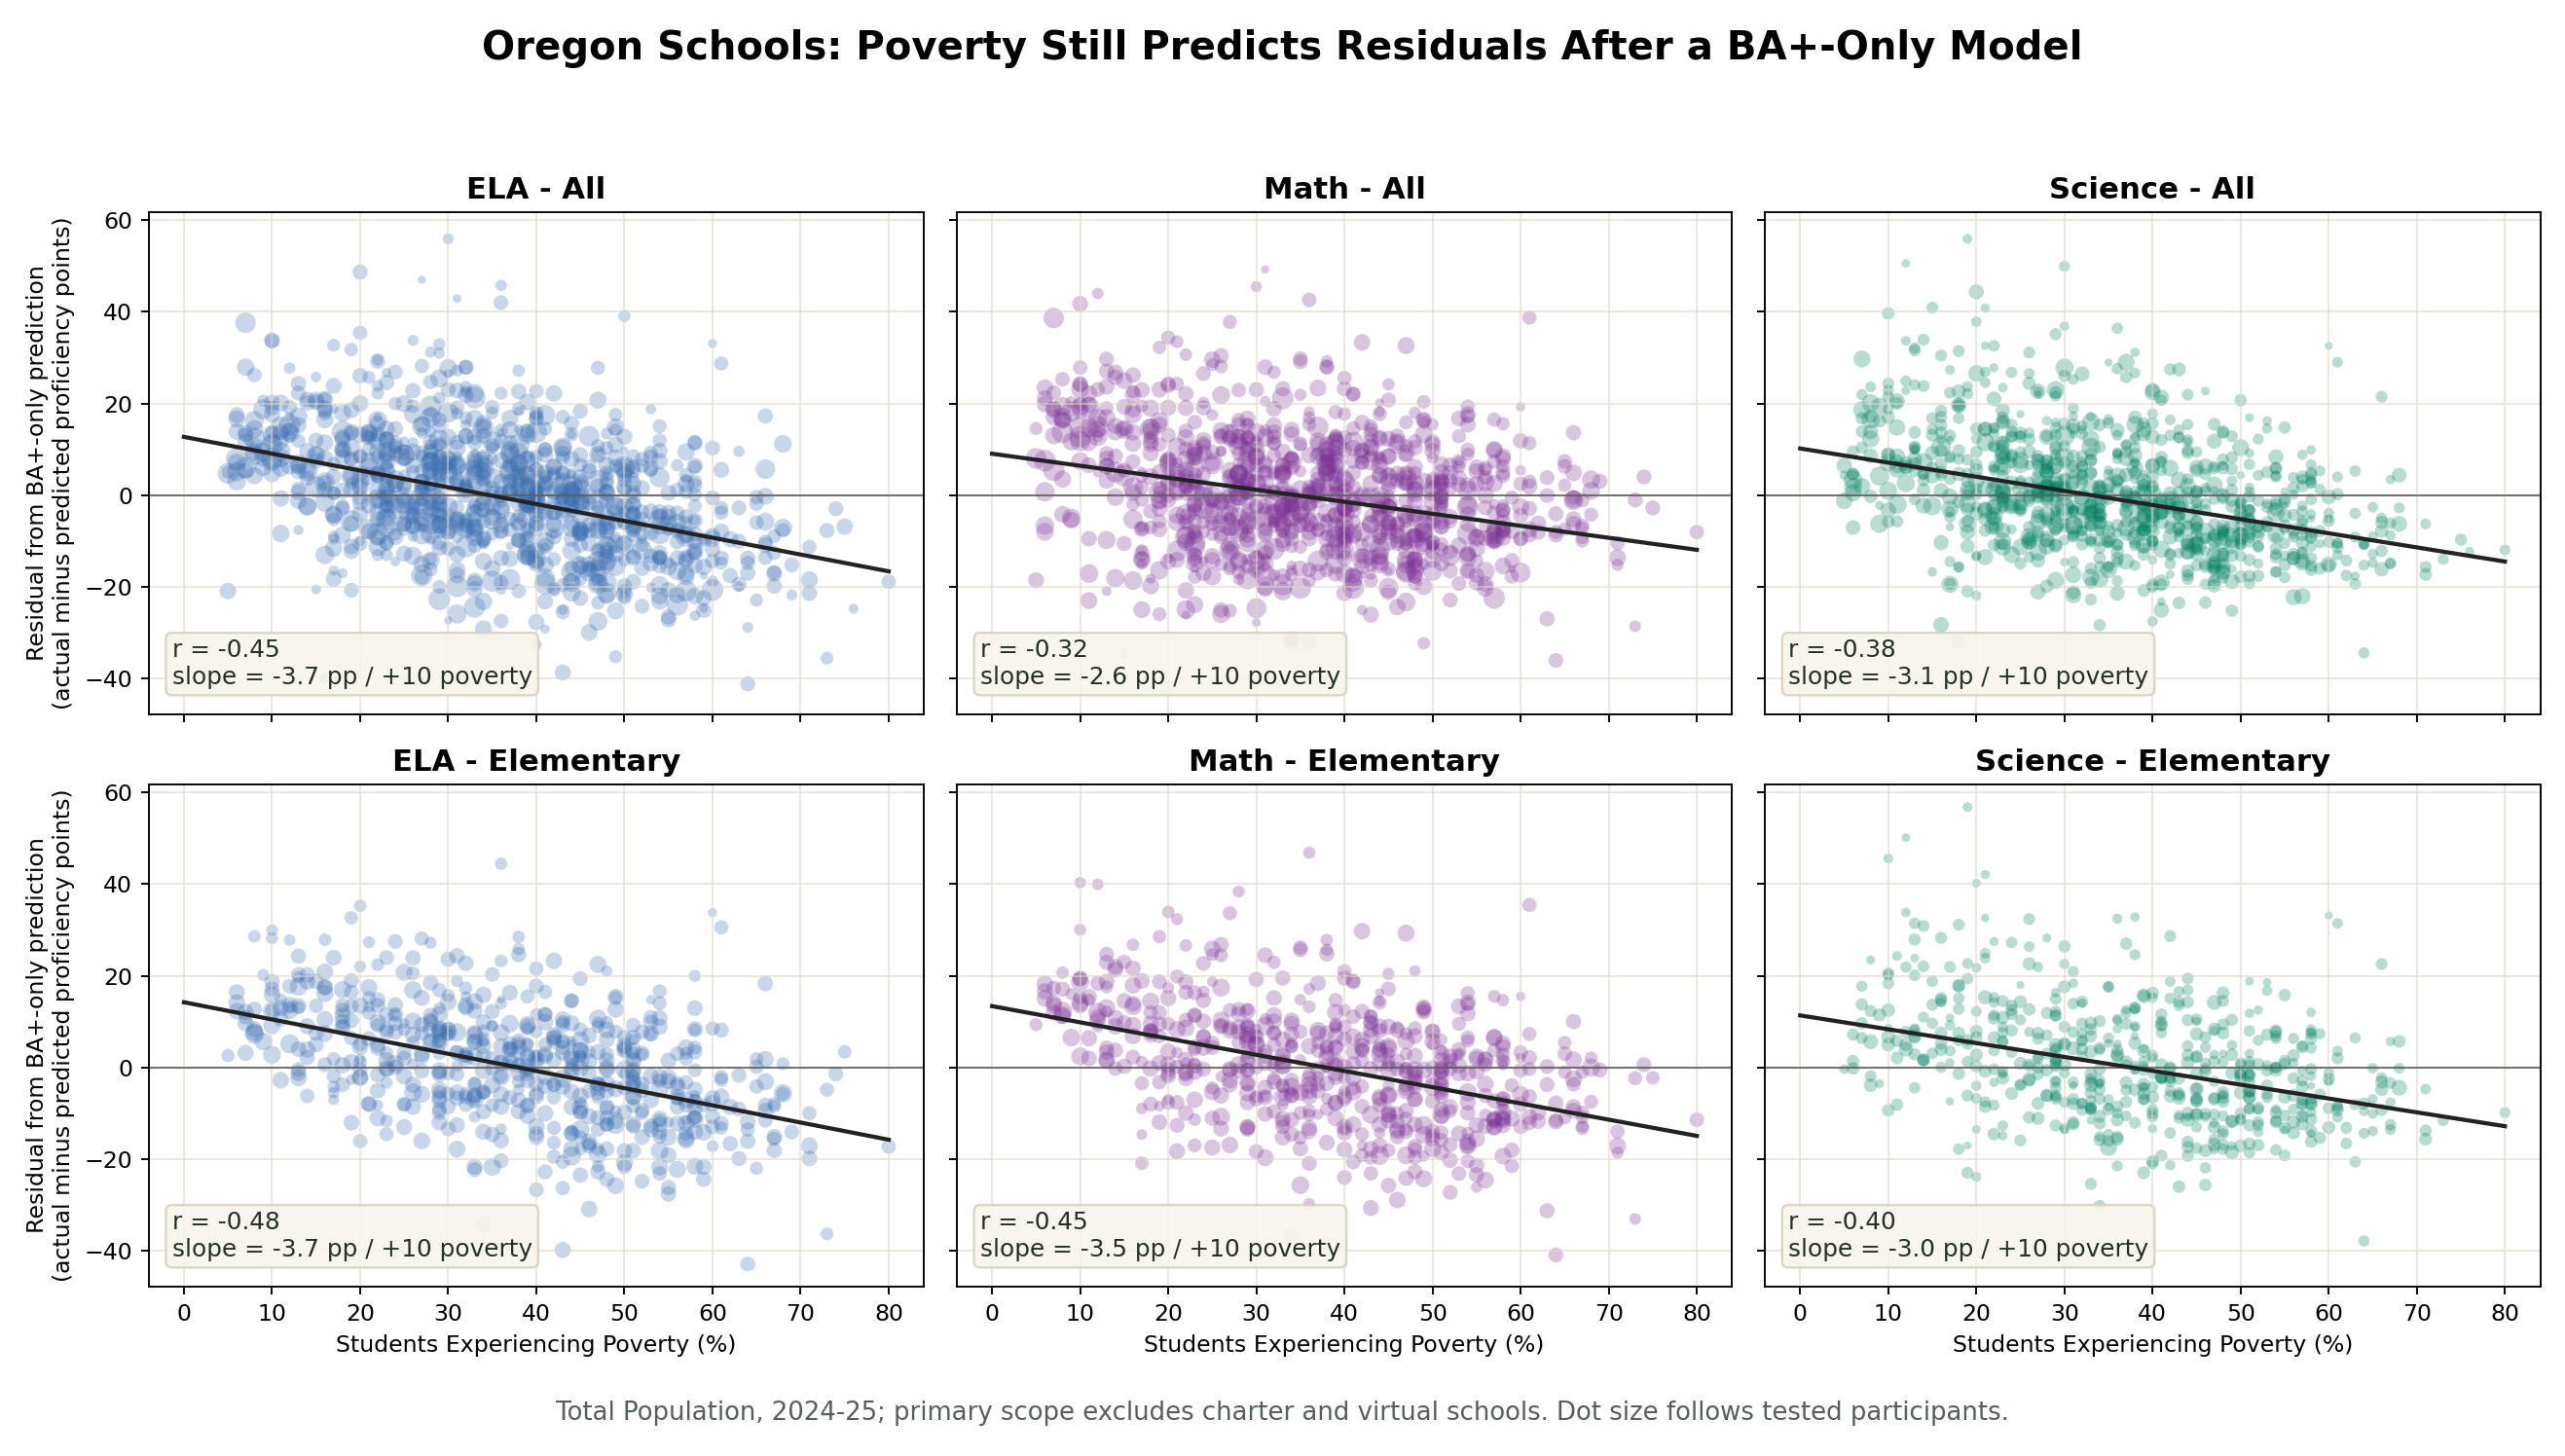
Poverty-aware companion checks (2024-25)
In ordinary-school cross-validated tests, replacing income with
Students Experiencing Poverty materially improved fit in all three subjects.
- ELA CV R^2: 0.5152 (income spec) vs 0.6516 (poverty spec); with both: 0.6622.
- Math CV R^2: 0.6394 (income spec) vs 0.6750 (poverty spec); with both: 0.6762.
- Science CV R^2: 0.3803 (income spec) vs 0.5072 (poverty spec); with both: 0.5188.
Interpretation: poverty appears to be a closer school-population hardship signal, while income remains useful community context.
These values use the median-household-income continuity spec; the poverty explainer includes a per-capita-income variant with slightly different baselines.
Interaction effects
Interaction terms improved fit in every subject. The largest incremental gains were typically tied to
education x attendance, indicating the strength of one factor can change by the level of the other.
- ELA: interaction model Delta R^2 = +0.015
- Math: interaction model Delta R^2 = +0.031
- Science: interaction model Delta R^2 = +0.031
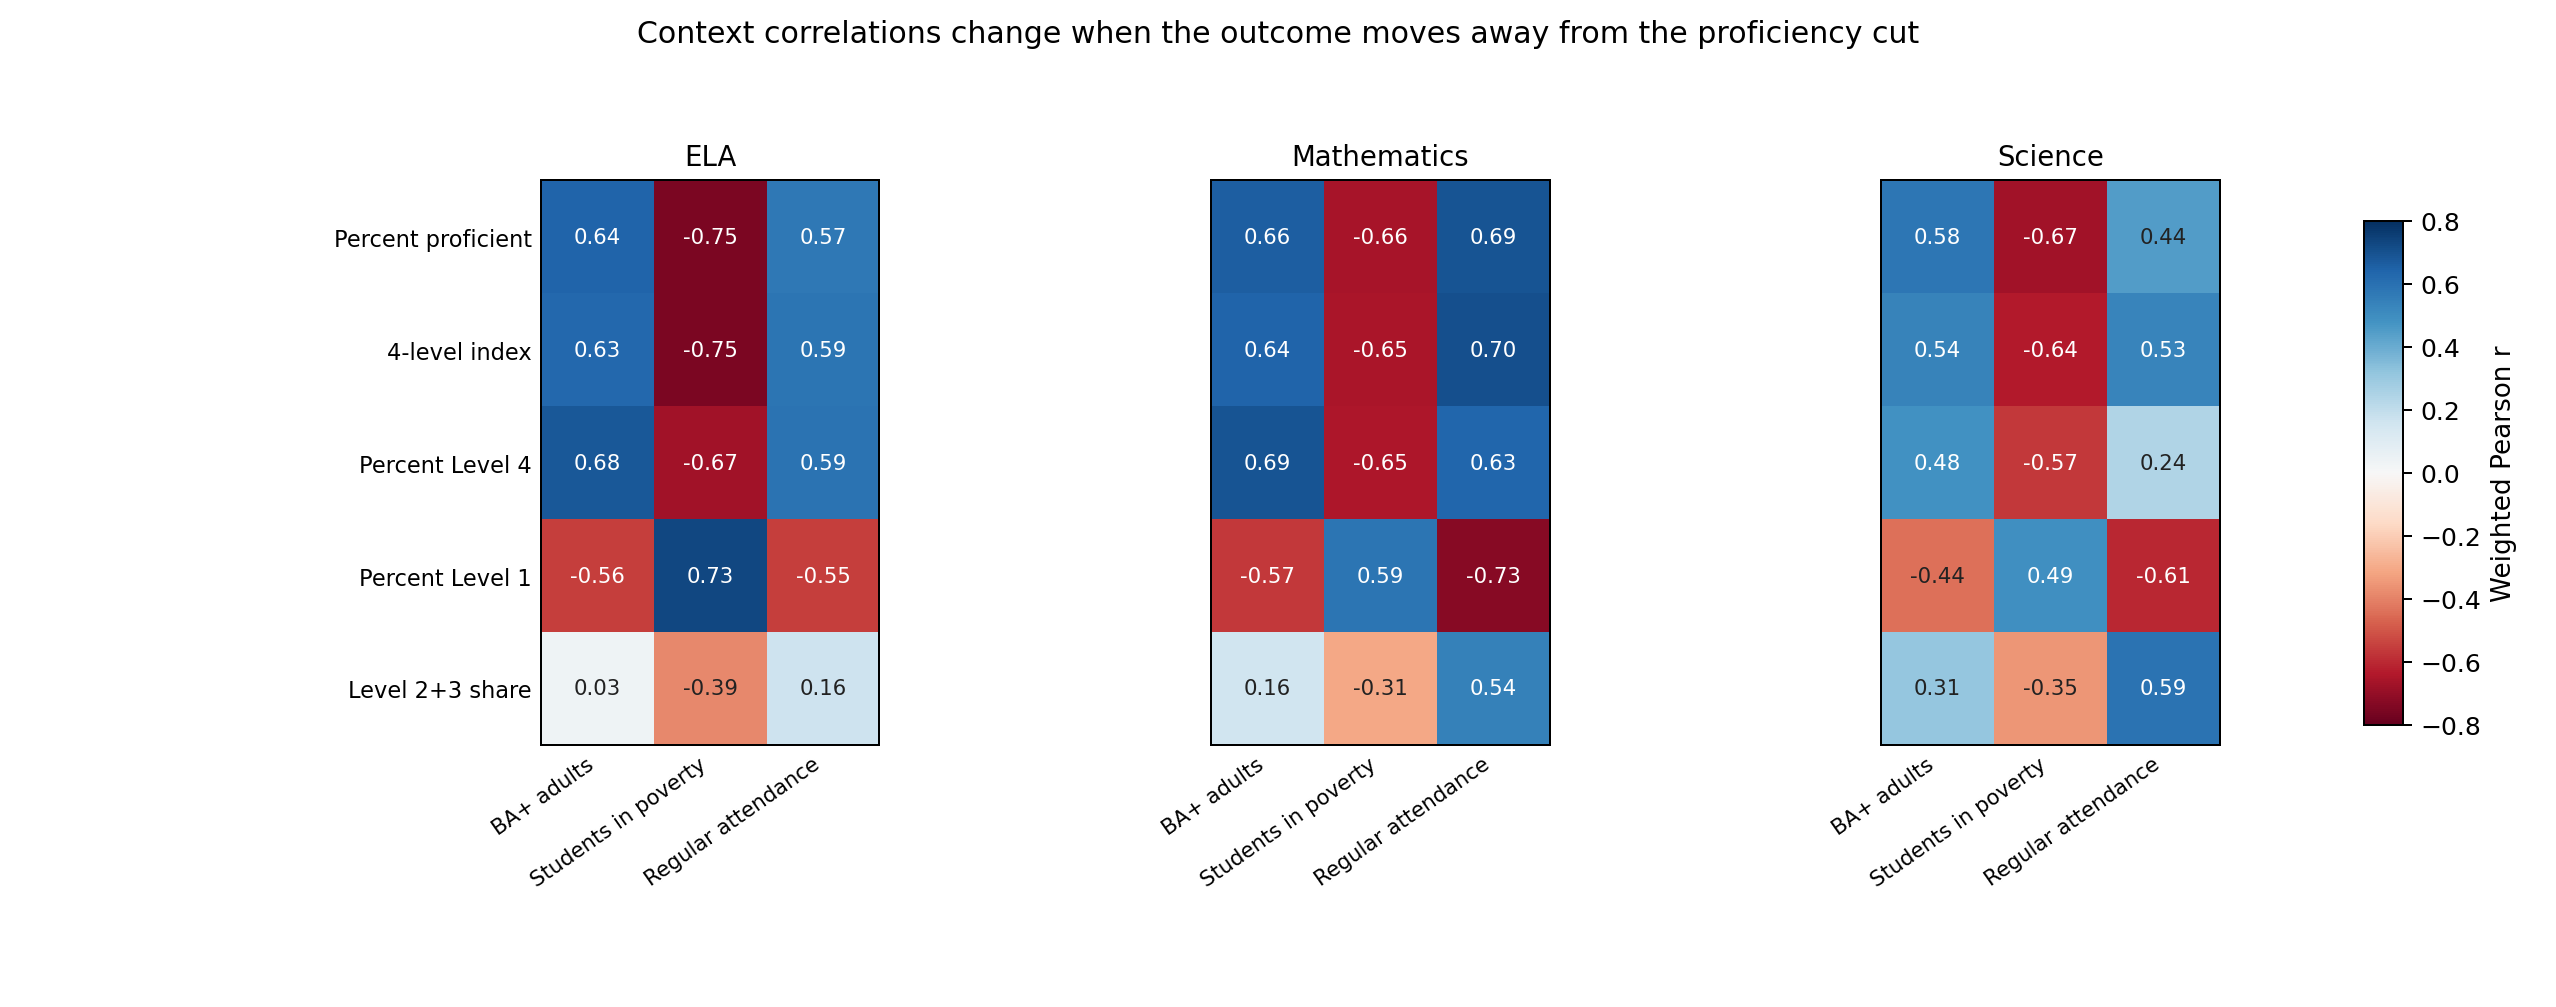
Outcome-level heterogeneity
For high-end outcomes (for example, Math Percent Level 4), the adult-education signal can become especially strong.
In one representative run, Level 4 had beta income = 0.132 vs beta education = 0.534 (R^2 = 0.399).
Spending and class size
Spending variables are highly collinear with each other and with SES context. Ridge and permutation-based checks
showed weaker and less stable contributions than the leading context signals. Median class size was often near-zero after controls.
Robustness
- Split-sample checks preserve education > income ordering.
- 2024-25 poverty-aware checks preserve a meaningful BA+ signal while showing that school poverty is also a first-tier predictor.
- Pre-pandemic 2018-2019 Math analyses (with era-appropriate ACS) preserve the same ordering.
- Magnitude shifts with scope filters, but ordering is stable.
Responsible interpretation
- These are association models, not causal estimates.
- School-level aggregation can hide within-school heterogeneity.
- Use consistency across model families and split checks as the main robustness lens.
Report and script index
Reports are grouped with the source files or machine-readable outputs that produced them.
The companion full-text exports are included where they are useful for auditing.
Overview and SES Baseline
Poverty-Aware Checks
Robustness, Outcomes, and Resources