Andrew Ho argues that proficiency percentages can be technically correct yet misleading because they summarize a score distribution at one cut score. This report asks what that concern means for Oregon's 2024-25 school achievement analyses, where the main summary outcome is usually Percent Proficient.
Proficiency threshold sensitivity
Ho-style read of Oregon 2024-25 achievement levels. Analysis regenerated: 2026-08-06.
- Data: Oregon 2024-25 school achievement rows from the processed ELA, math, and science files.
- Rows: Total Population, grade-specific rows only; All Grades science rows are excluded to avoid double-counting.
- Filters: charter, virtual, and curated special-enrollment schools excluded.
- Aggregation: school-subject totals across tested grades, using achievement-level counts.
- Inclusion threshold: at least 30 students with reported Level 1-4 results after aggregation.
- ODE inequality disclosures such as
<5%use the interval midpoint for computation, with raw tokens and legal bounds retained in the processed data.
Ho's warning applies, but it does not overturn the broad SES findings. Percent Proficient is Oregon's Level 3 plus Level 4 share, so it hides whether students are concentrated in Level 1 versus Level 2 or Level 3 versus Level 4. When the same data are summarized with a simple four-level index, adult BA+ context, student poverty, and attendance remain strongly associated with achievement.
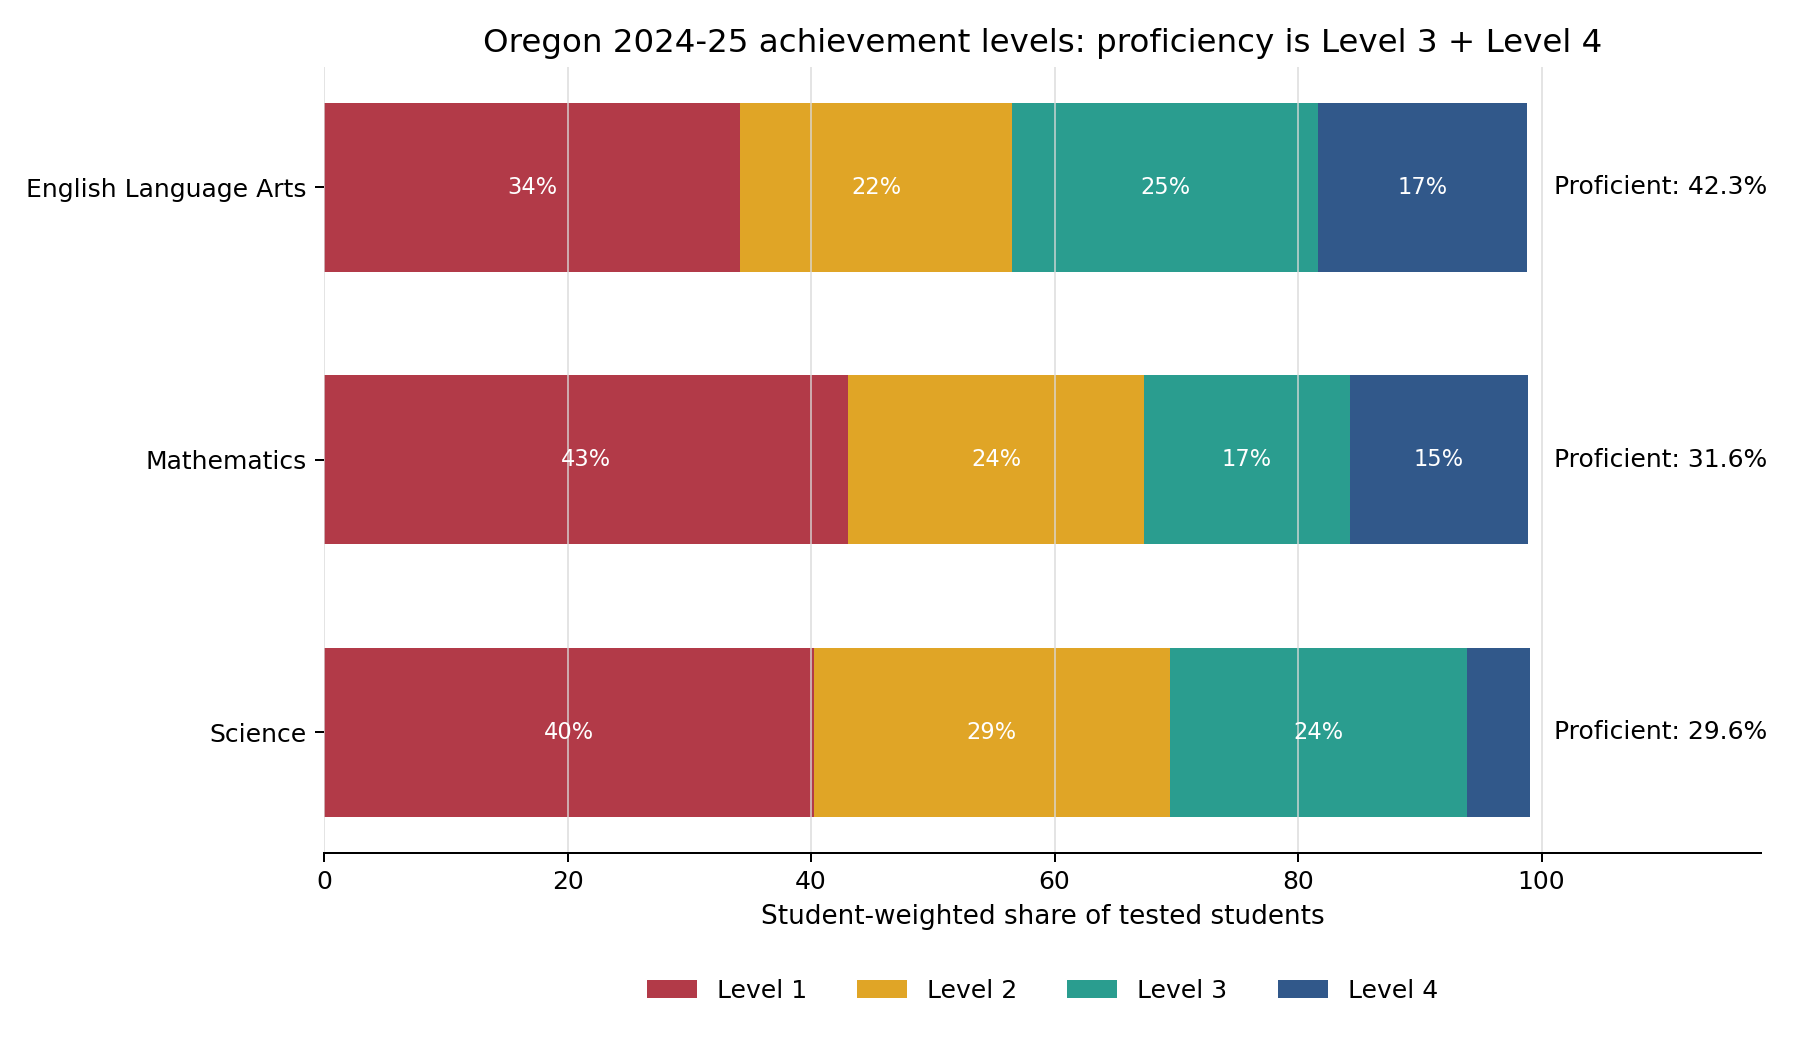
The index assigns Level 1 = 1, Level 2 = 2, Level 3 = 3, and Level 4 = 4, then averages those values using student counts. It is not an official scale score. It is a sensitivity check that asks whether the same SES relationships appear when all four achievement buckets are used instead of only the Level 2/3 proficiency cut. All percentages and analysis weights use students with reported Level 1-4 results.
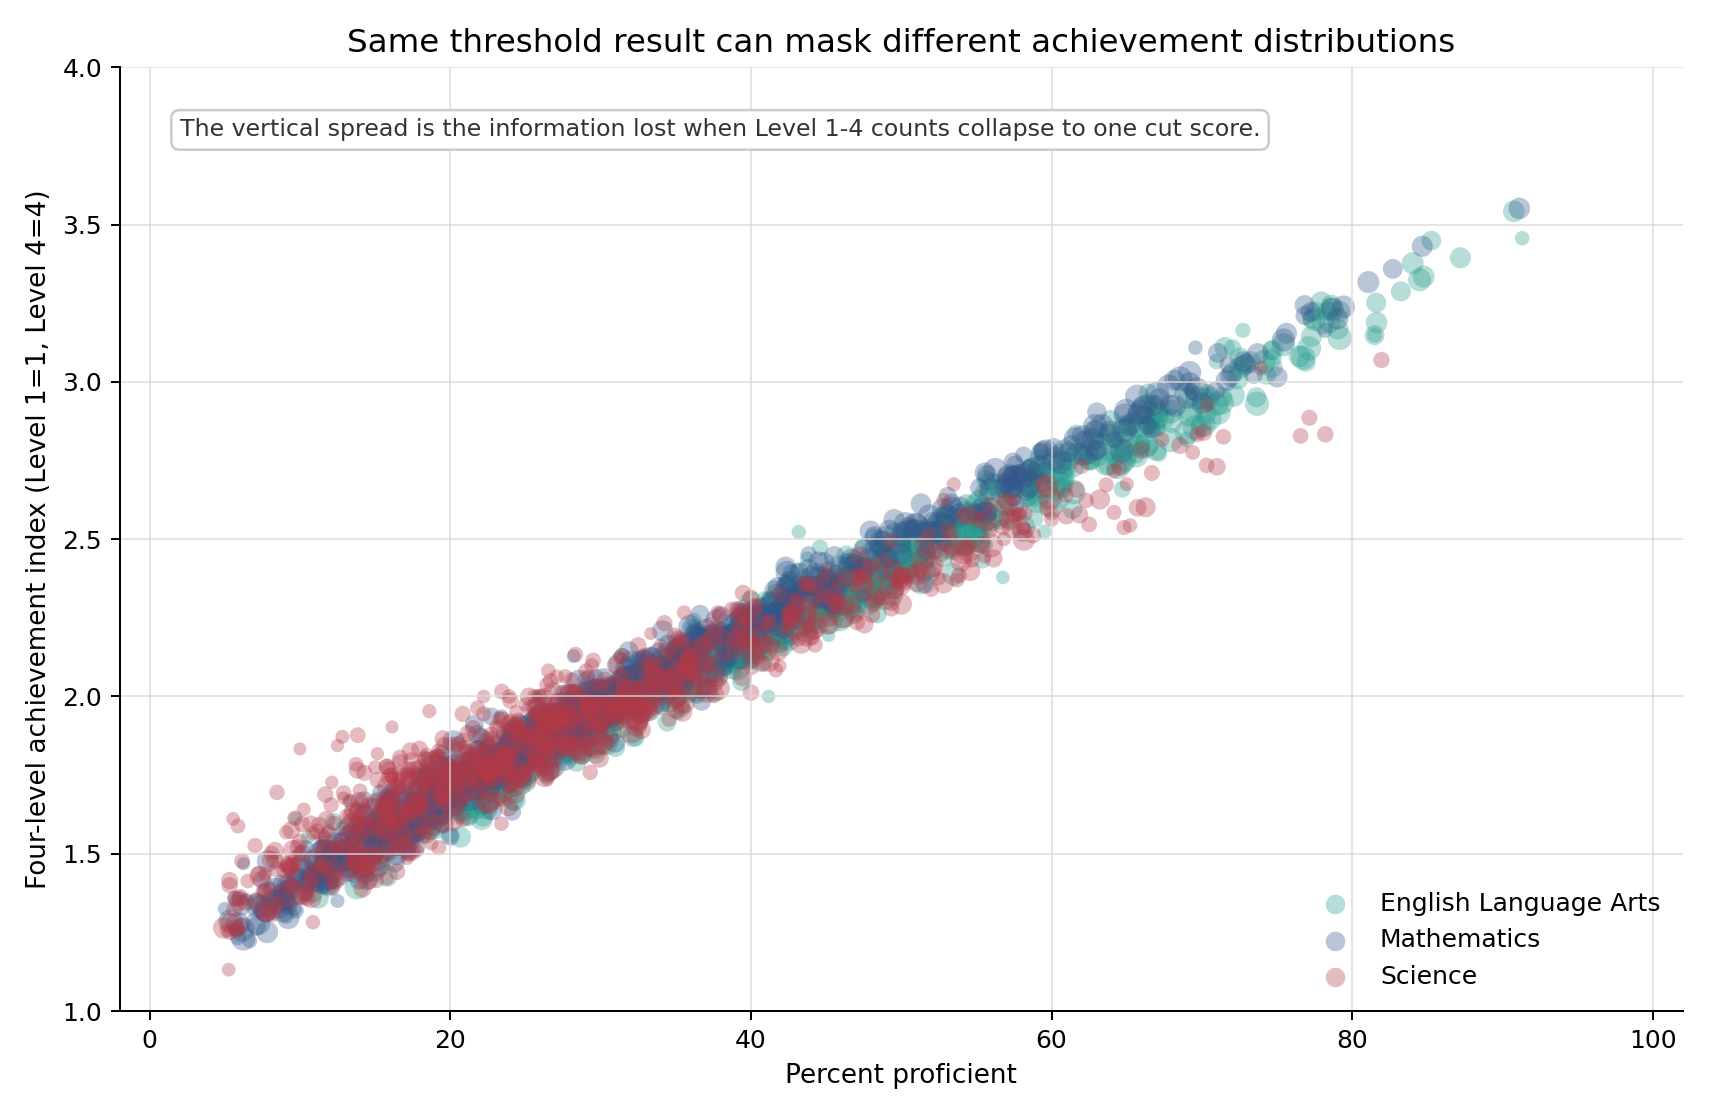
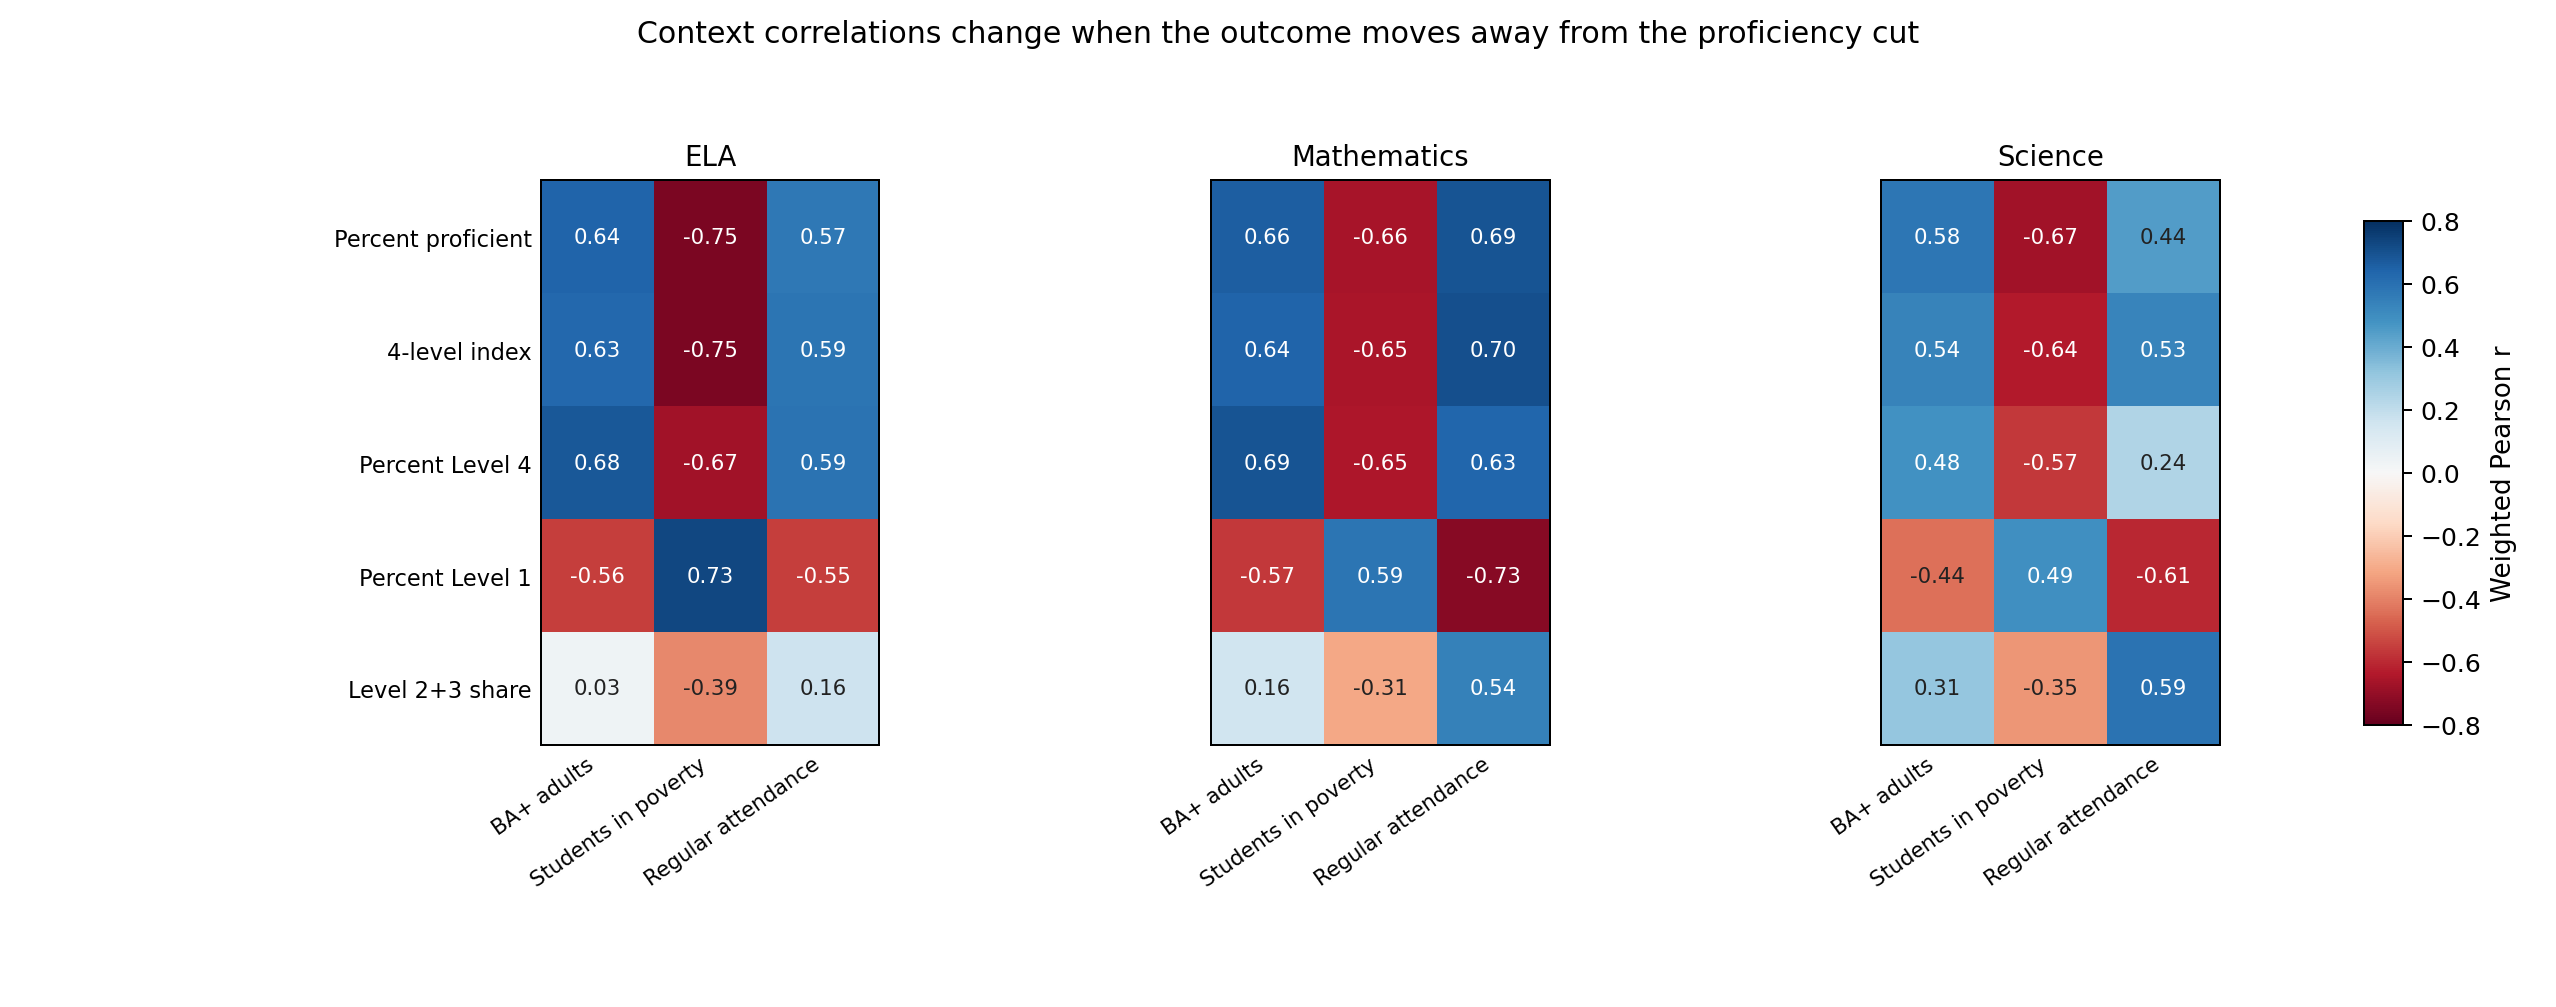
- ELA: Percent Proficient correlations are BA+ +0.65, poverty -0.75, attendance +0.57; the four-level index is +0.64, -0.75, +0.58.
- Math: Percent Proficient correlations are BA+ +0.66, poverty -0.66, attendance +0.69; the four-level index is +0.65, -0.65, +0.70.
- Science: Percent Proficient correlations are BA+ +0.58, poverty -0.67, attendance +0.44; the four-level index is +0.55, -0.63, +0.52.
Because the equal-spacing assumption is unproven, the analysis tested alternate scoring rules: extra Level 4 premiums, stronger Level 1 penalties, a compressed middle, and a near-pass-friendly Level 2 score. Across those core alternatives, the SES correlations stayed in the same range: BA+ remained positive, poverty remained negative, and attendance remained positive. The exact index value is not sacred, but the main SES association is not driven by the equal-spacing assumption.
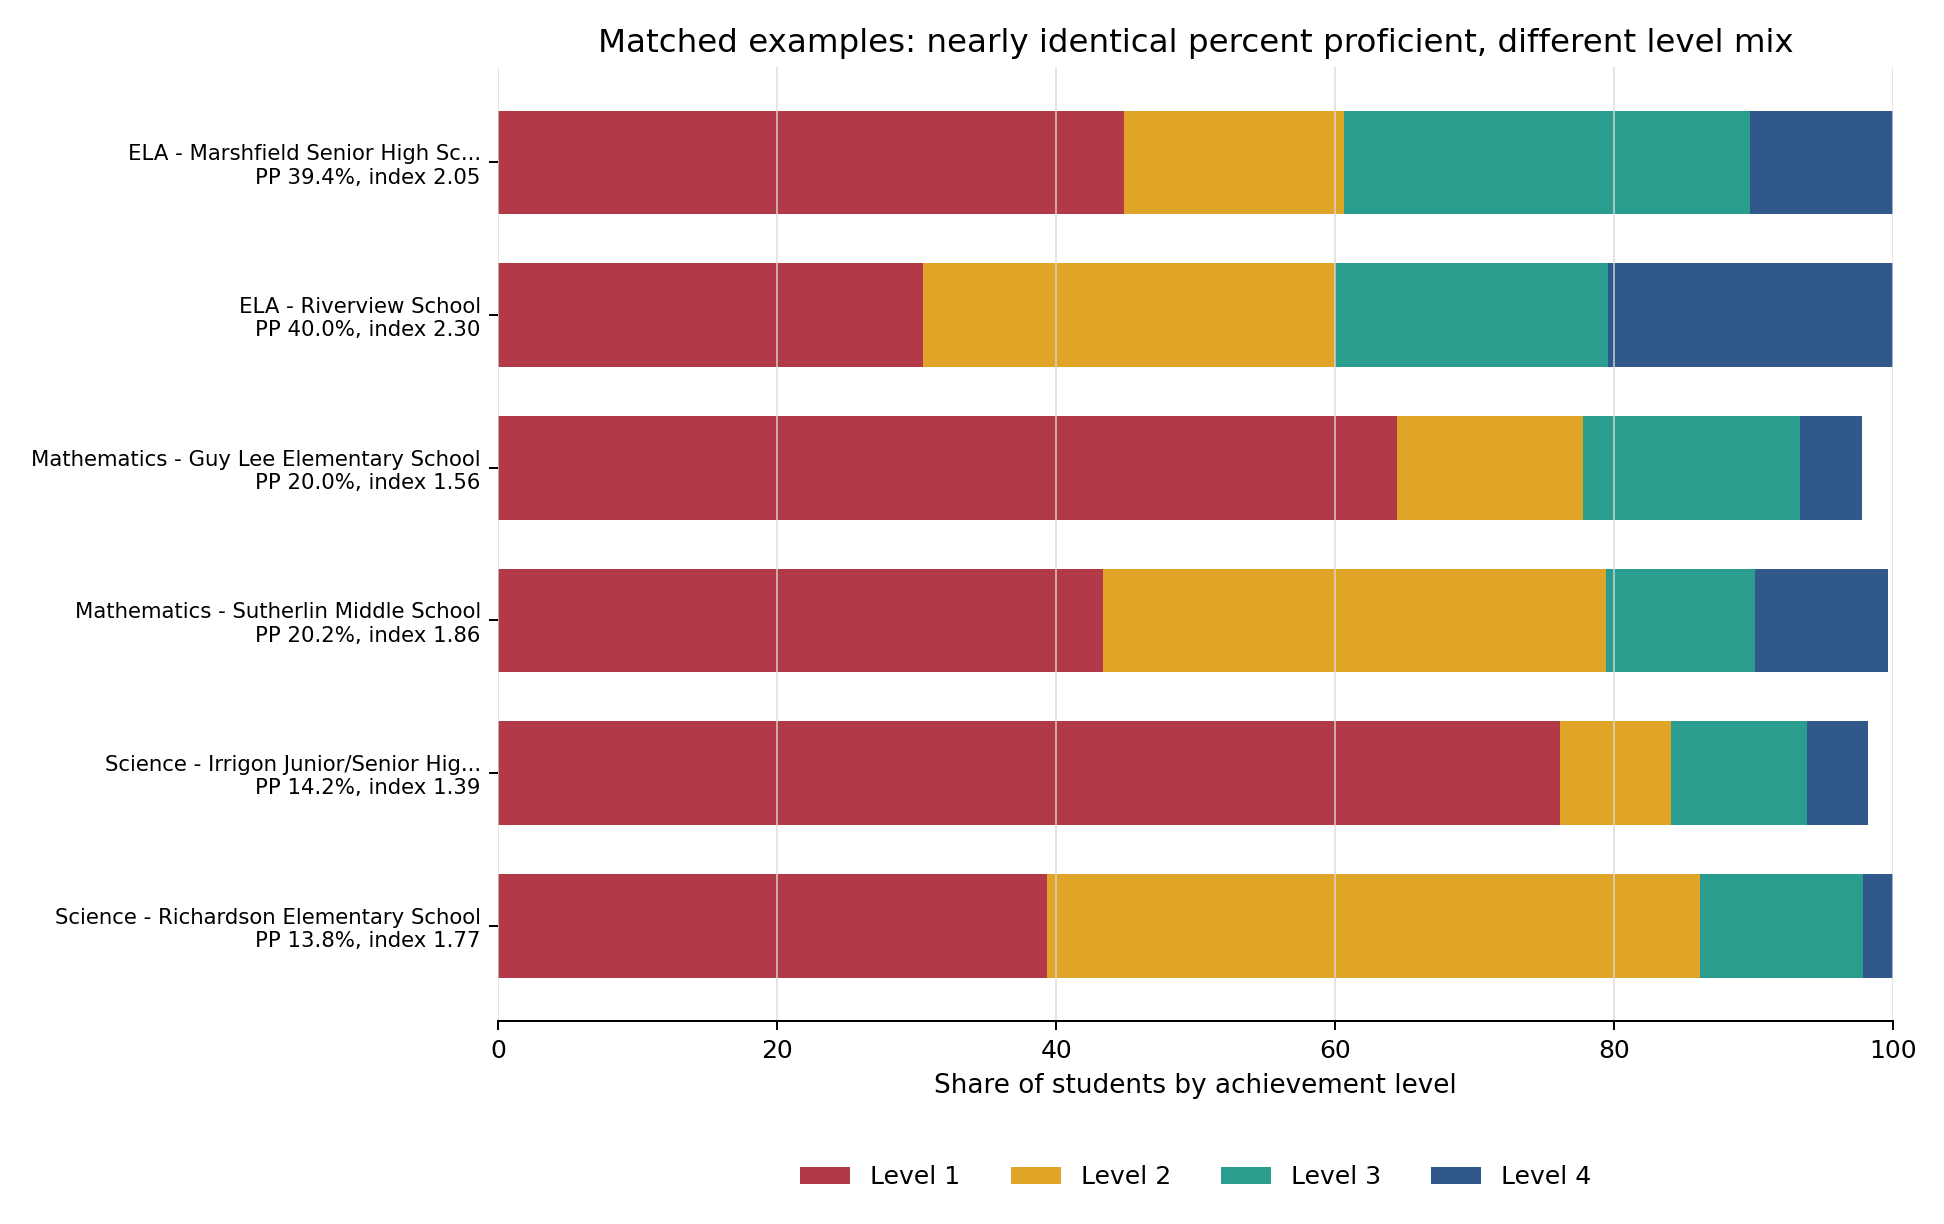
- Percent Proficient remains useful as a descriptive snapshot, but it should not carry the whole evidentiary load.
- Statewide SES findings look robust to the four-level index and to alternate level-spacing rules.
- Individual school comparisons need more caution: pair proficiency with Level 1, Level 4, or stacked Level 1-4 distributions.
- Trend claims remain the hardest case because school-level public data do not provide scale-score means or percentile points.
Ho, A. D. (2008). The problem with "proficiency": Limitations of statistics and policy under No Child Left Behind. Educational Researcher, 37(6), 351-360. https://doi.org/10.3102/0013189X08323842